Smart Energy Meter (ESP8266)
Monitoring energy usage in real time.
So in the UK, there is a scheme to roll out ‘smart meters’ to every home that will provide electricity and gas usage over the air to some device that sits on your kitchen counter (as well as to the energy provider). There have been many hold-ups as well as some hardware issues. So I decided to build my own and plug it into the home network.
Parts
I used the following for this build:
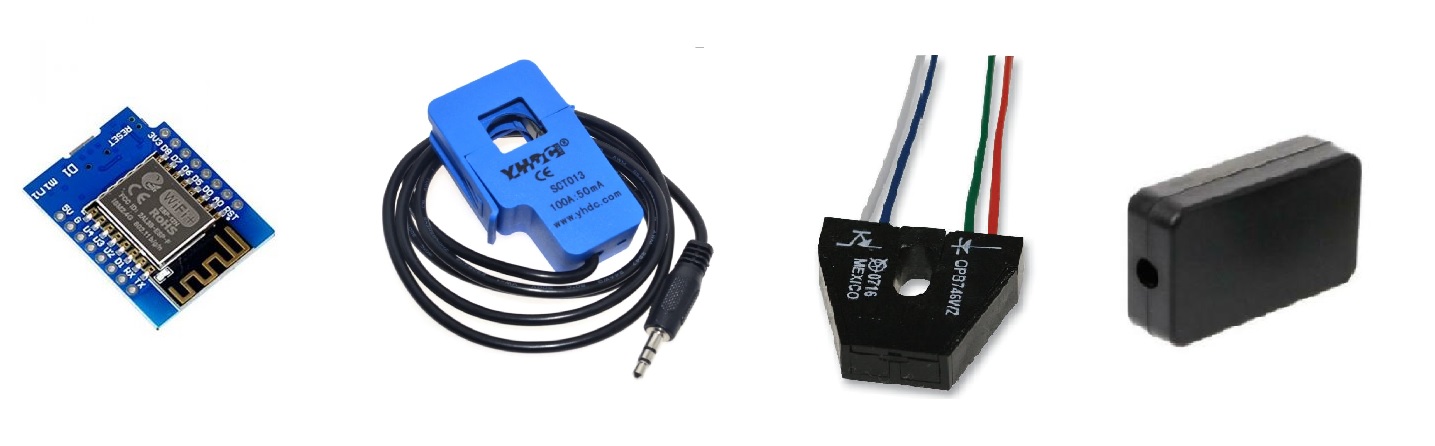
- ESP8266 Wifi-enabled microprocessor (in this case a Wemos D1 variant)
- Non-invasive AC current sensor 100A (SCT-013-000)
- Reflective sensor (Optek OPB743WZ)
- 55x35x15mm plastic enclosure
- Resistors, capacitor, wires, etc.
Electricity
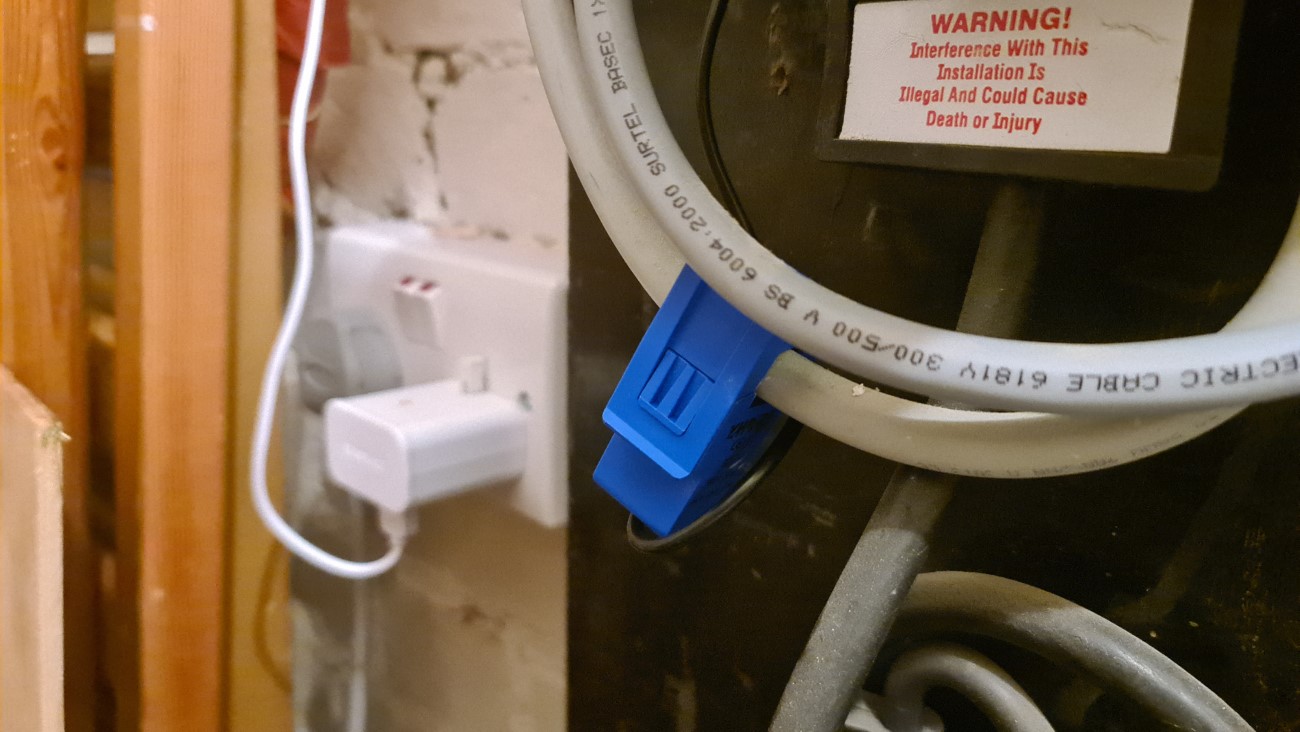
So this was the somewhat easier parameter to measure as the SCT-013-000 AC sensor pretty simple to use. You just clip it around either the live or neutral wire anywhere you have AC mains power and it varies its voltage output proportional to the current passing through it. You could put one of these on literally any mains cable, so you have the option to measure the consumption of individual appliances. But you will have to split the cable to get to the neutral or live line (otherwise they cancel each other out and you get no reading).
I simply clipped this on the live line coming into the electricity meter which is conveniently already separated from neutral, so required no insulation removal.
I used the schematic detailed at OpenEnergyMonitor, but with slightly different resistors due to the 3.3V logic of the ESP8266 (a 22ohm for the burden).
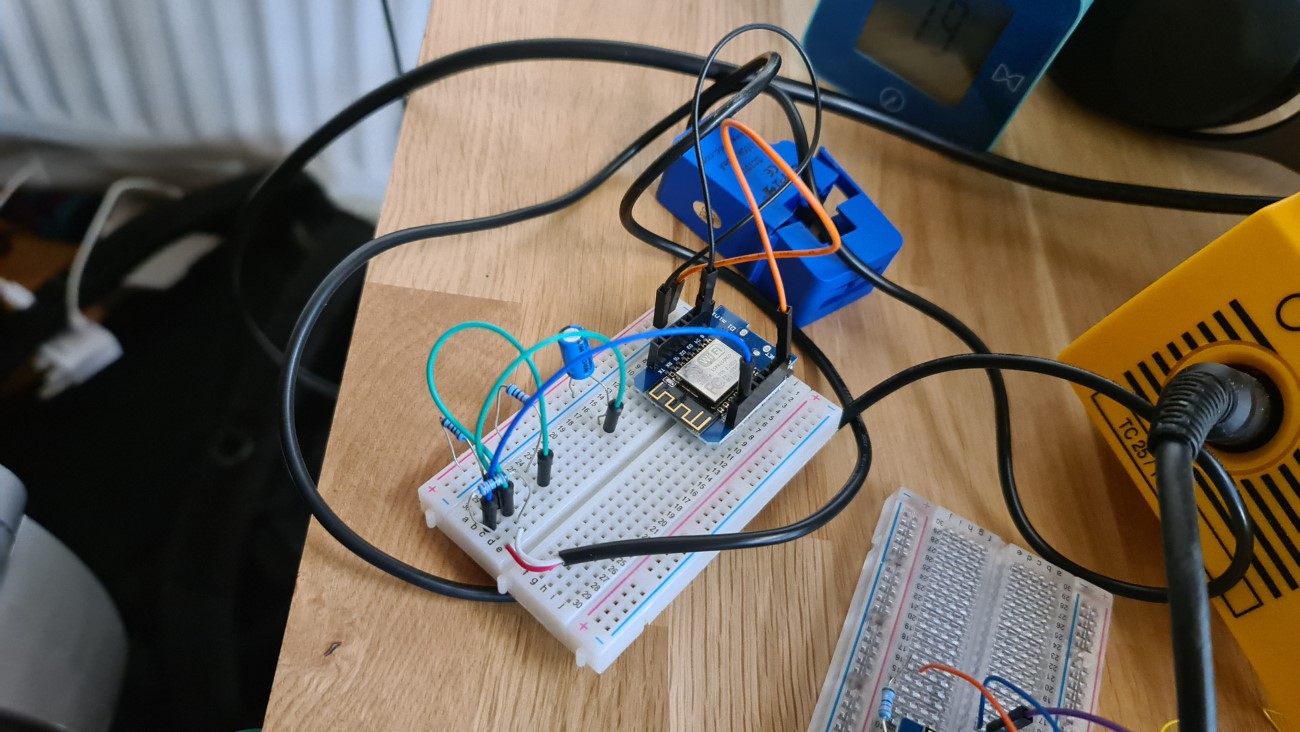
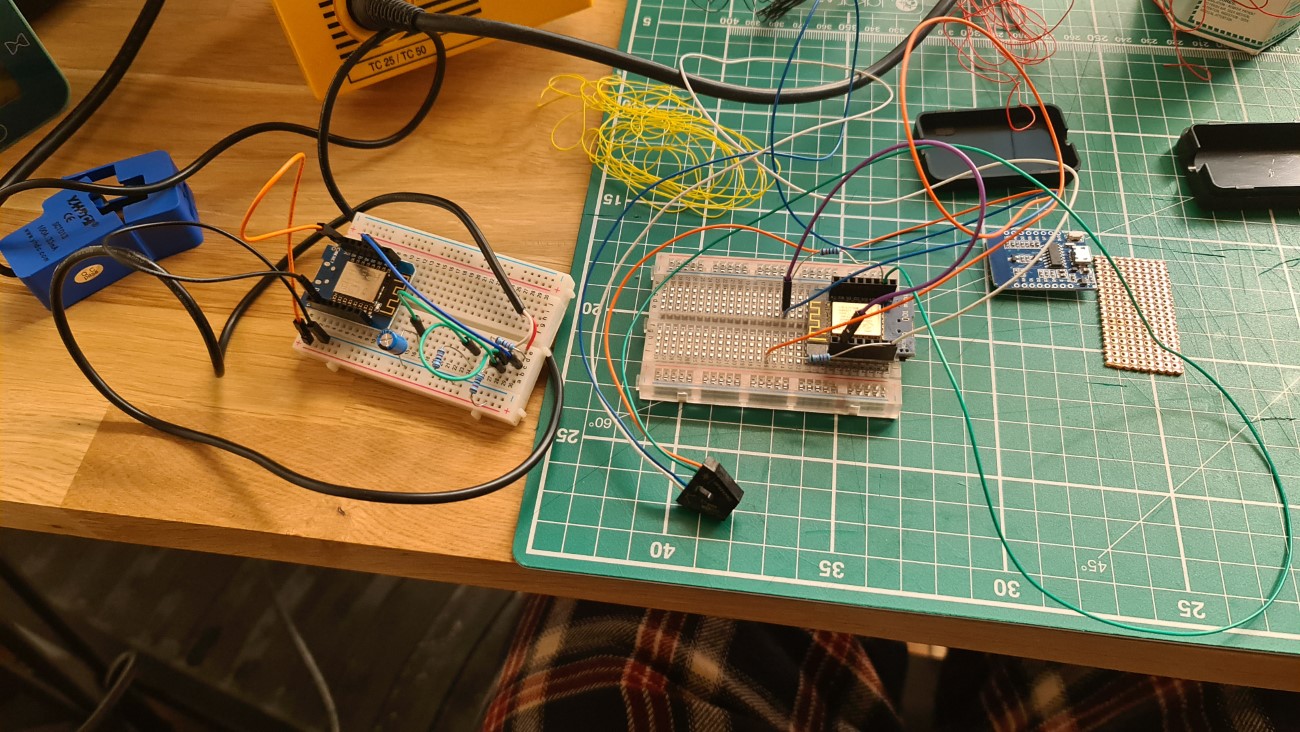
The breadboard prototype is here:
The ESP8266 has a single analog input on pin A0, so the code is a simple analogRead(A0)to get the raw data out, but with the excellent EmonLib library, you can get the wattage straight out (code here from OpenEnergyMonitor).
The data is essentially live use in watts. Or rather the current in amps, but multiplied by 230V (or 110V in the US) to give you watts. This is interesting, but will need a slightly more useful format to mean much which we’ll cover later.
Gas
So we can just use a clip-on gas flow sensor just like we did for electricity, right?
Sadly, no.
The gas detection is a little more involved. Or rather less involved and more inferred. The only realistic way to get gas use is from the meter itself as the gas inside literally turns a dial and we have no way of detecting this externally.
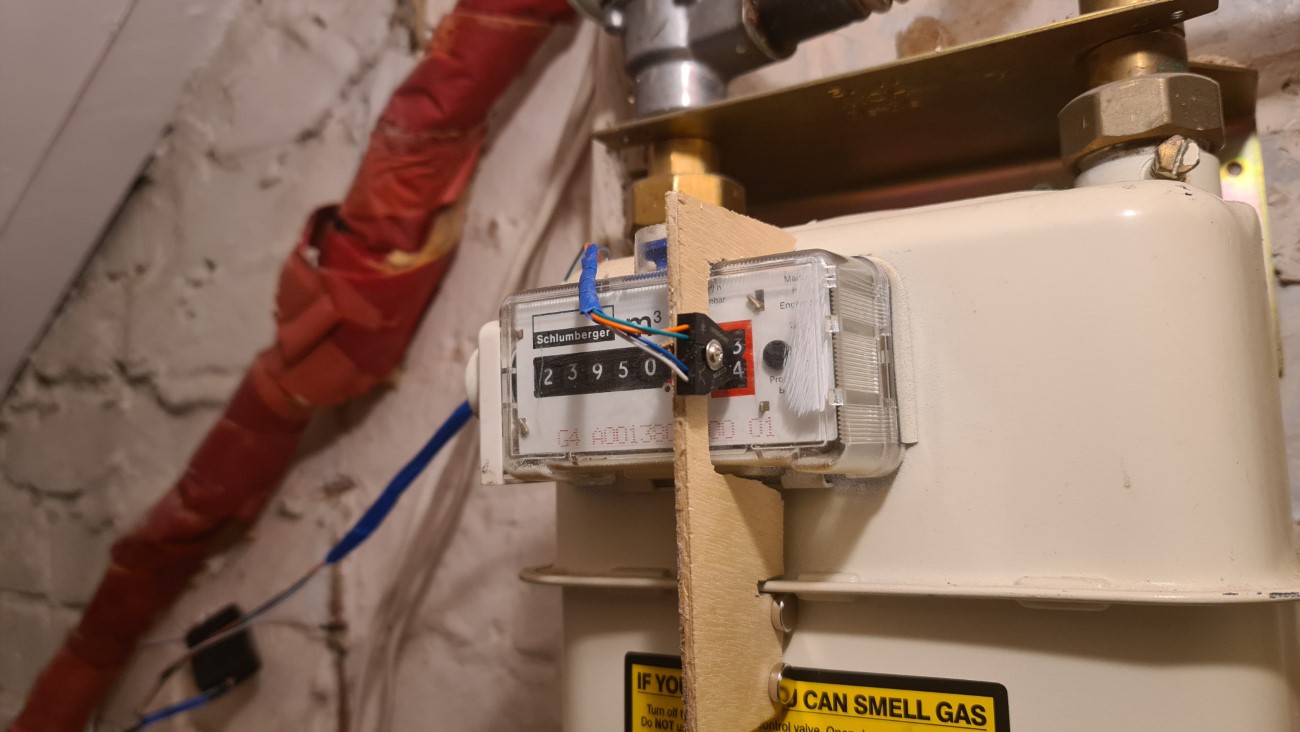
There are a variety of gas meters, some have magnetic parts in the dial that you can pick up with a hall sensor (I tried this but couldn’t pick anything up), while others have something more subtle. The last dial (0.00x m3 on mine) has a zero character filled in with reflective paint. Like a silver ‘0’.
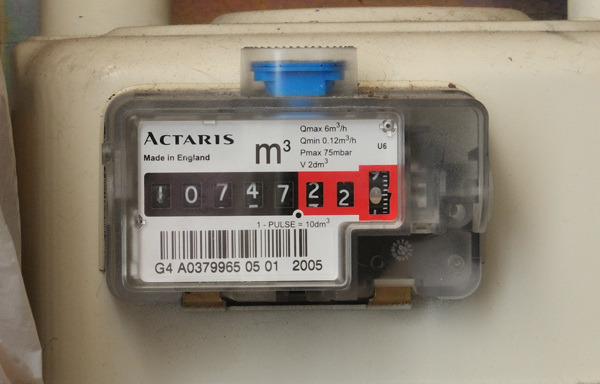
This can be read with a reflective optical sensor (ROS) like those manufactured by Optek. These are pretty neat devices with a range of applications and are very simple in their operation - an LED (normally infrared) is housed right next to a photo-transistor (i.e. a transistor [a digital ‘swich’] that is on or off depending on light being present). So you point it at something close and it picks up the reflected light from its LED and allows voltage through. This is commonly used in factory automation for counting things, or even in smart vacuum cleaners for detecting objects or stairs.
So a ROS placed in front of that dial with a silvered zero gives you a signal whenever that zero comes around, allowing you to determine the meter reading and current use.
The first issue I had is that this uses an NPN transistor that allows a shade of your voltage through based on how much reflection you get. So it works easiest when wired into the analog input on the ESP8266, giving a nice, strong peak when the 0 came around:
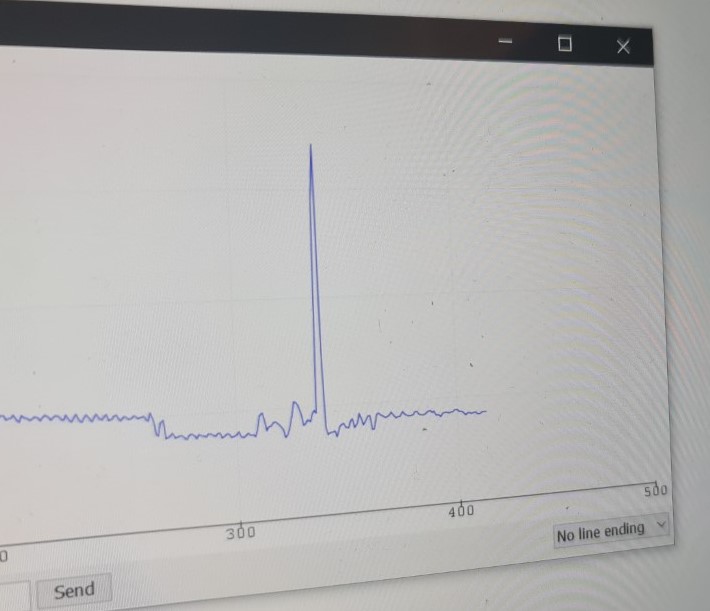
note the smaller bumps before the peak which is the 8 and 9 still reflecting the IR light to a lesser extent
This was a great and clear result, but I wanted to combine the gas and electricity reading on the one ESP8266 which comes with just the one analog pin. So instead of wiring in an external analog-digital converter (ADC), I just added in a little stronger pull-down resistor (11k) to threshold the signal to either ‘on’ or ‘off’ - allowing me to wire this to a digital pin on the ESP8266.
So here were my so far separate energy monitoring ESPs:
Assembly
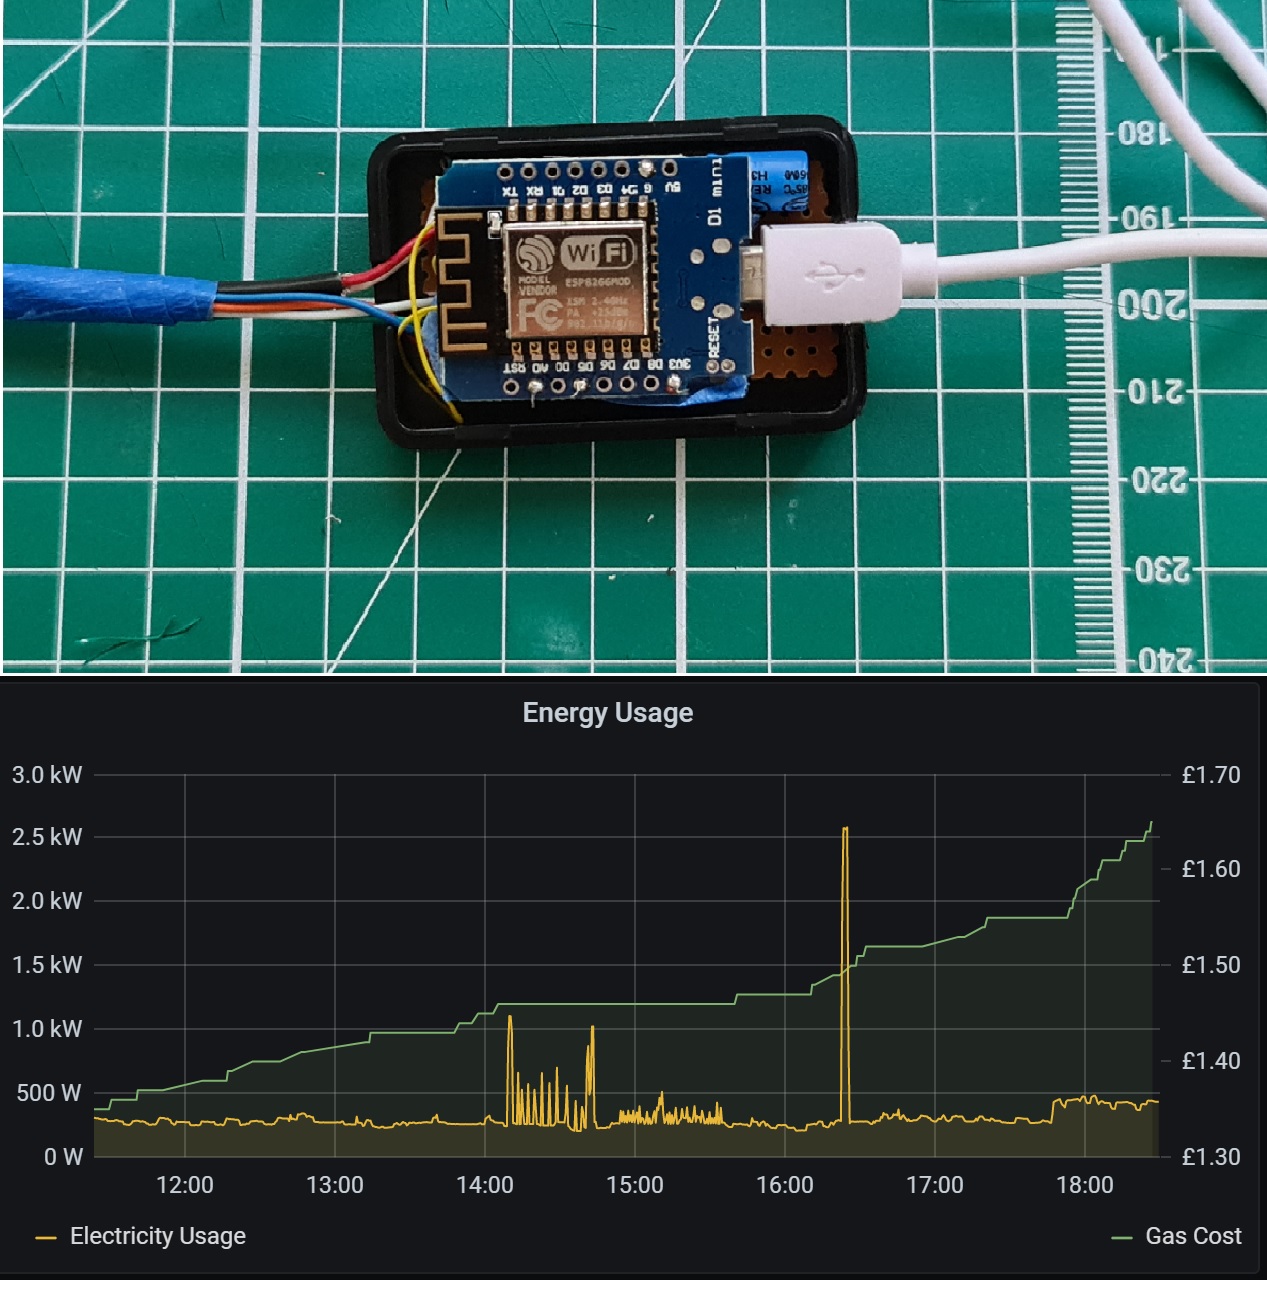
I found these small 55x35x15mm enclosures on eBay for about 50p a piece recently and thought it would be clever to try and fit the Wemos ESP board in with some prototyping board and solder all the components as close together as possible. Was a little challenging, but managing to compress it all to fit in the end. I did need to use a hot screwdriver to melt one side’s hole a bit wider to fit the microUSB plug (although I could’ve just cut the plug off and soldered the 5V and Ground lines straight to the board).
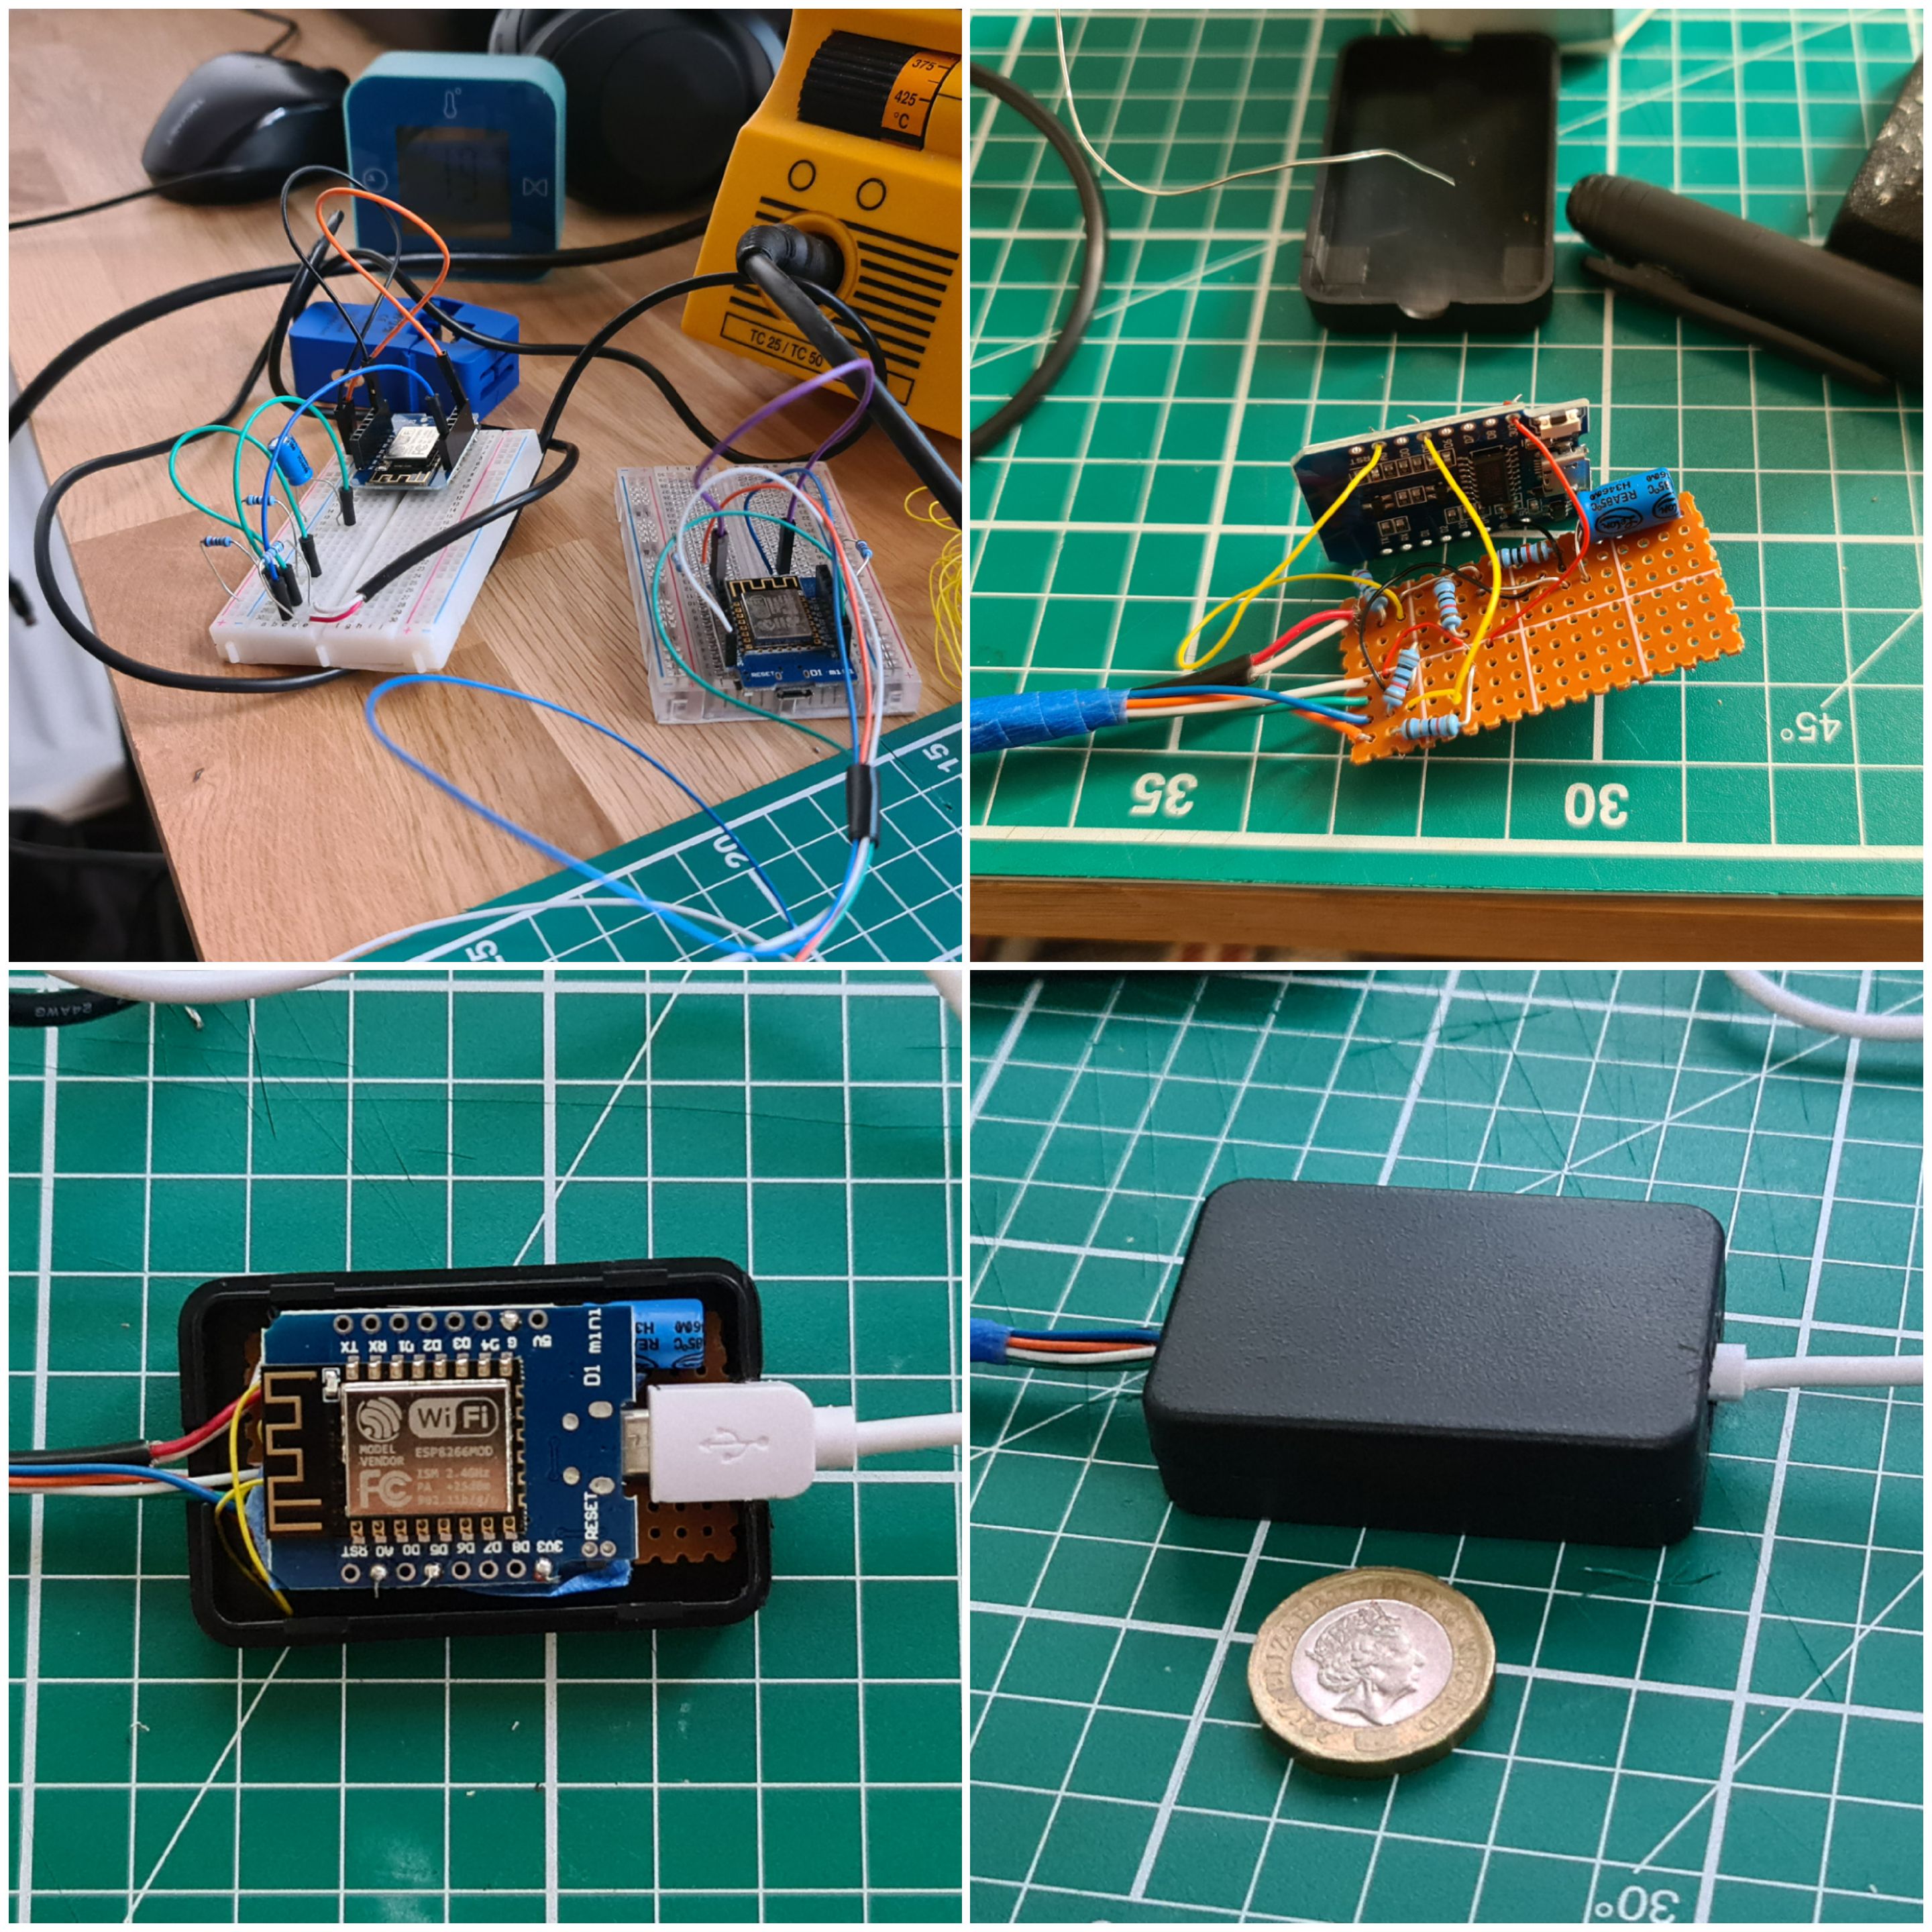
Finally, to get the optical sensor to stay in the right place, I cut a bit of plywood to fit with a coping saw and used four neodymium magnets to hold it in place on the meter, while still being able to read the whole meter.
Code
The code is here.
The code was fairly straight forward in that it had all the usual parts for OTA updates and publishing messages to Node Red via MQTT over Wifi plus the simple electricity reading command from the Emon library, and a straight up gas_reading = digitalRead(gaspin) for the optical sensor.
I added a little debouncing of sorts to make sure it didn’t accidentally read the gas twice as the 0 came round by only allowing it to publish the reading once every three seconds (it takes at least 10s for the dial to turn full rotation). As Sam pointed out to me, if it just reports when it sees a ‘0’ and I stop using gas at that exact point, the system would just keep counting it over and over. And this actually happened on the second day as my smart mirror informed I was using £30/day in gas!
So I added a simple toggling bit of code where instead of being triggered by just a ‘0’, it has to have read a non-zero before hand. I.e. the signal from the optical sensor is only interpreted if it goes from LOW to HIGH.
Finally, the payloads of the messages are made up of:
- Electricity in watts send every 1.5s (a specific time interval allows accurate calculation of usage)
- Gas in the number of milliseconds since the last ‘0’ on the dial. This works as just the presence of a message for each dial rotation, but also as a means of calculating the rate of use if needed later on
Node Red
The messages are received to two different MQTT topics in Node Red.
For electricity, a basic calculation was made to turn my energy provider’s cost in pence/kWh into pence/W1.5s. This can then be multiplied to provide the current cost of use and is cumulatively summed over the day to provide a ‘cost so far today’ as well as a projected ‘cost/month’.
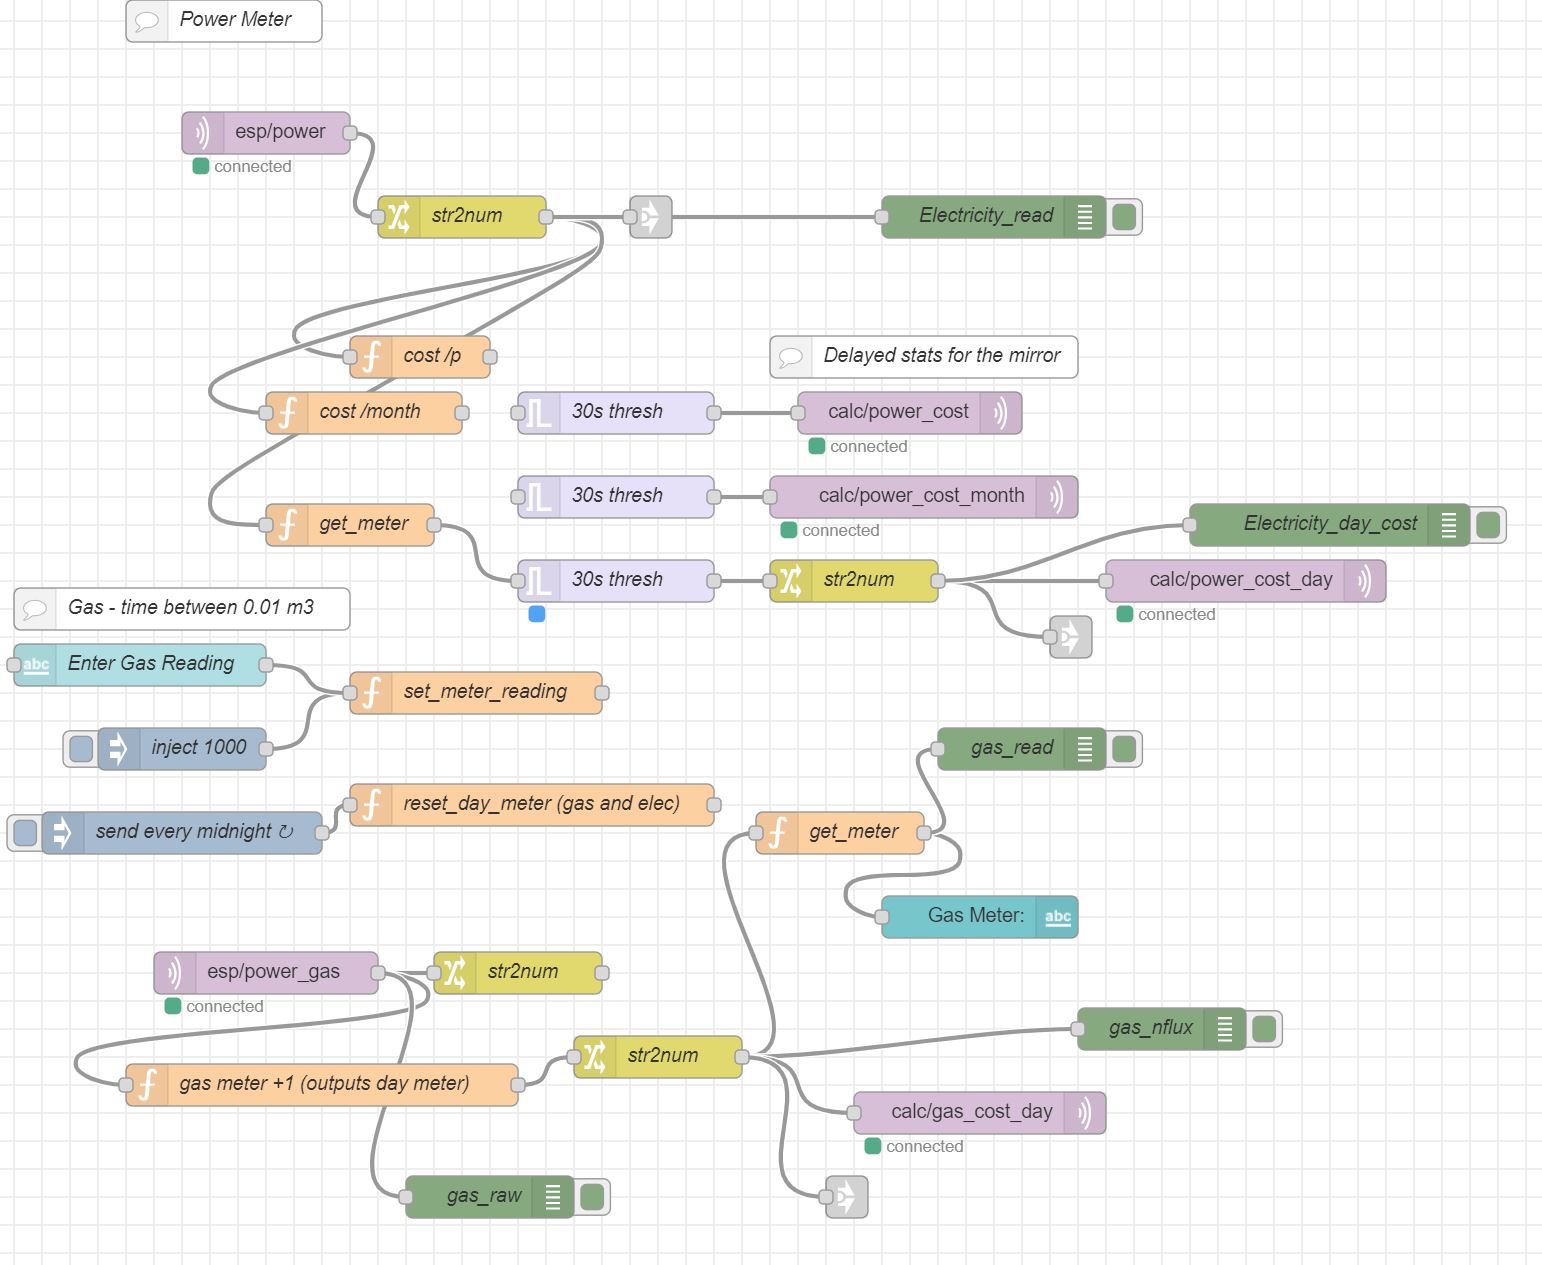
For gas, the message triggers a +0.01 to a stored variable for the current gas meter. I can check that this tallies with the meter itself and so essentially just digitises the meter reading. This can then be extrapolated into daily and monthly costs like the electricity.
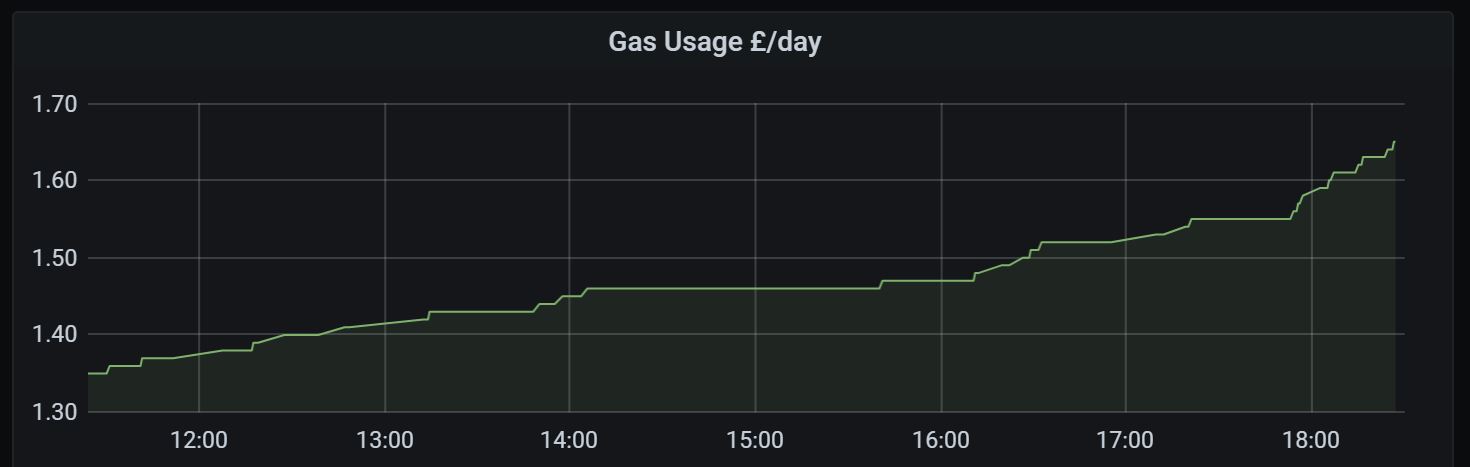
These calculated costs are then pushed to the smart mirror via new MQTT messages, and to the Influx database that is pulled into Grafana for plotting usage. Conveniently, I can also display Grafana panels on the smart mirror, so I have a stat & plot figure for electricity:
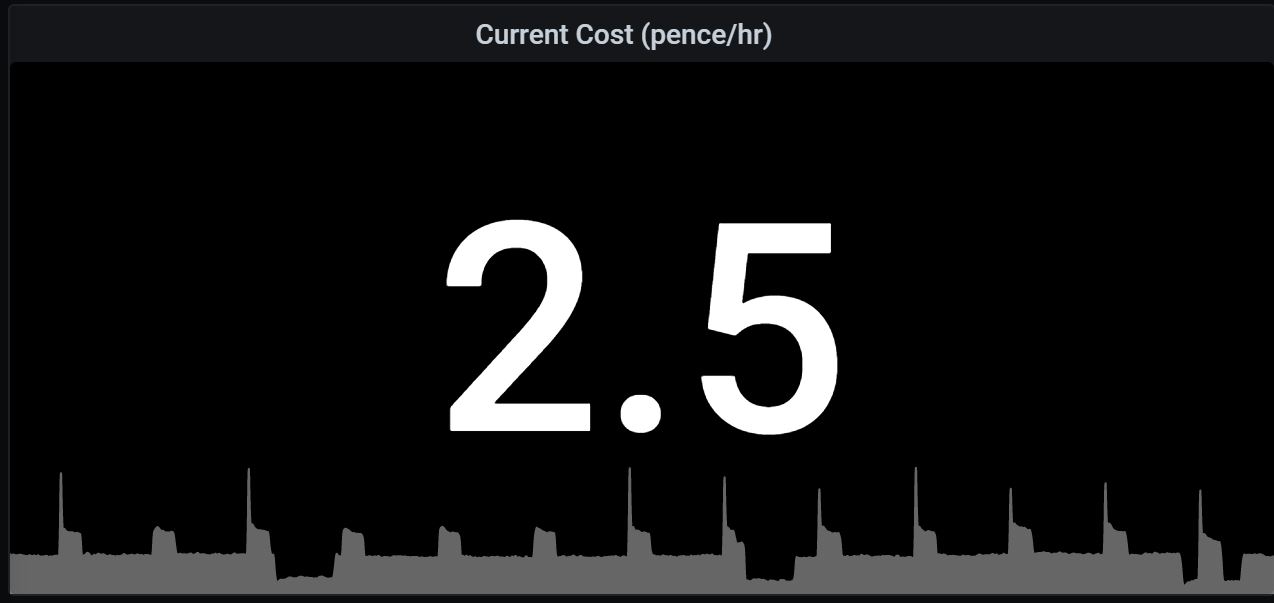 You can see in the plot where the fridge and freezer click on periodically.